Auditing Graphs
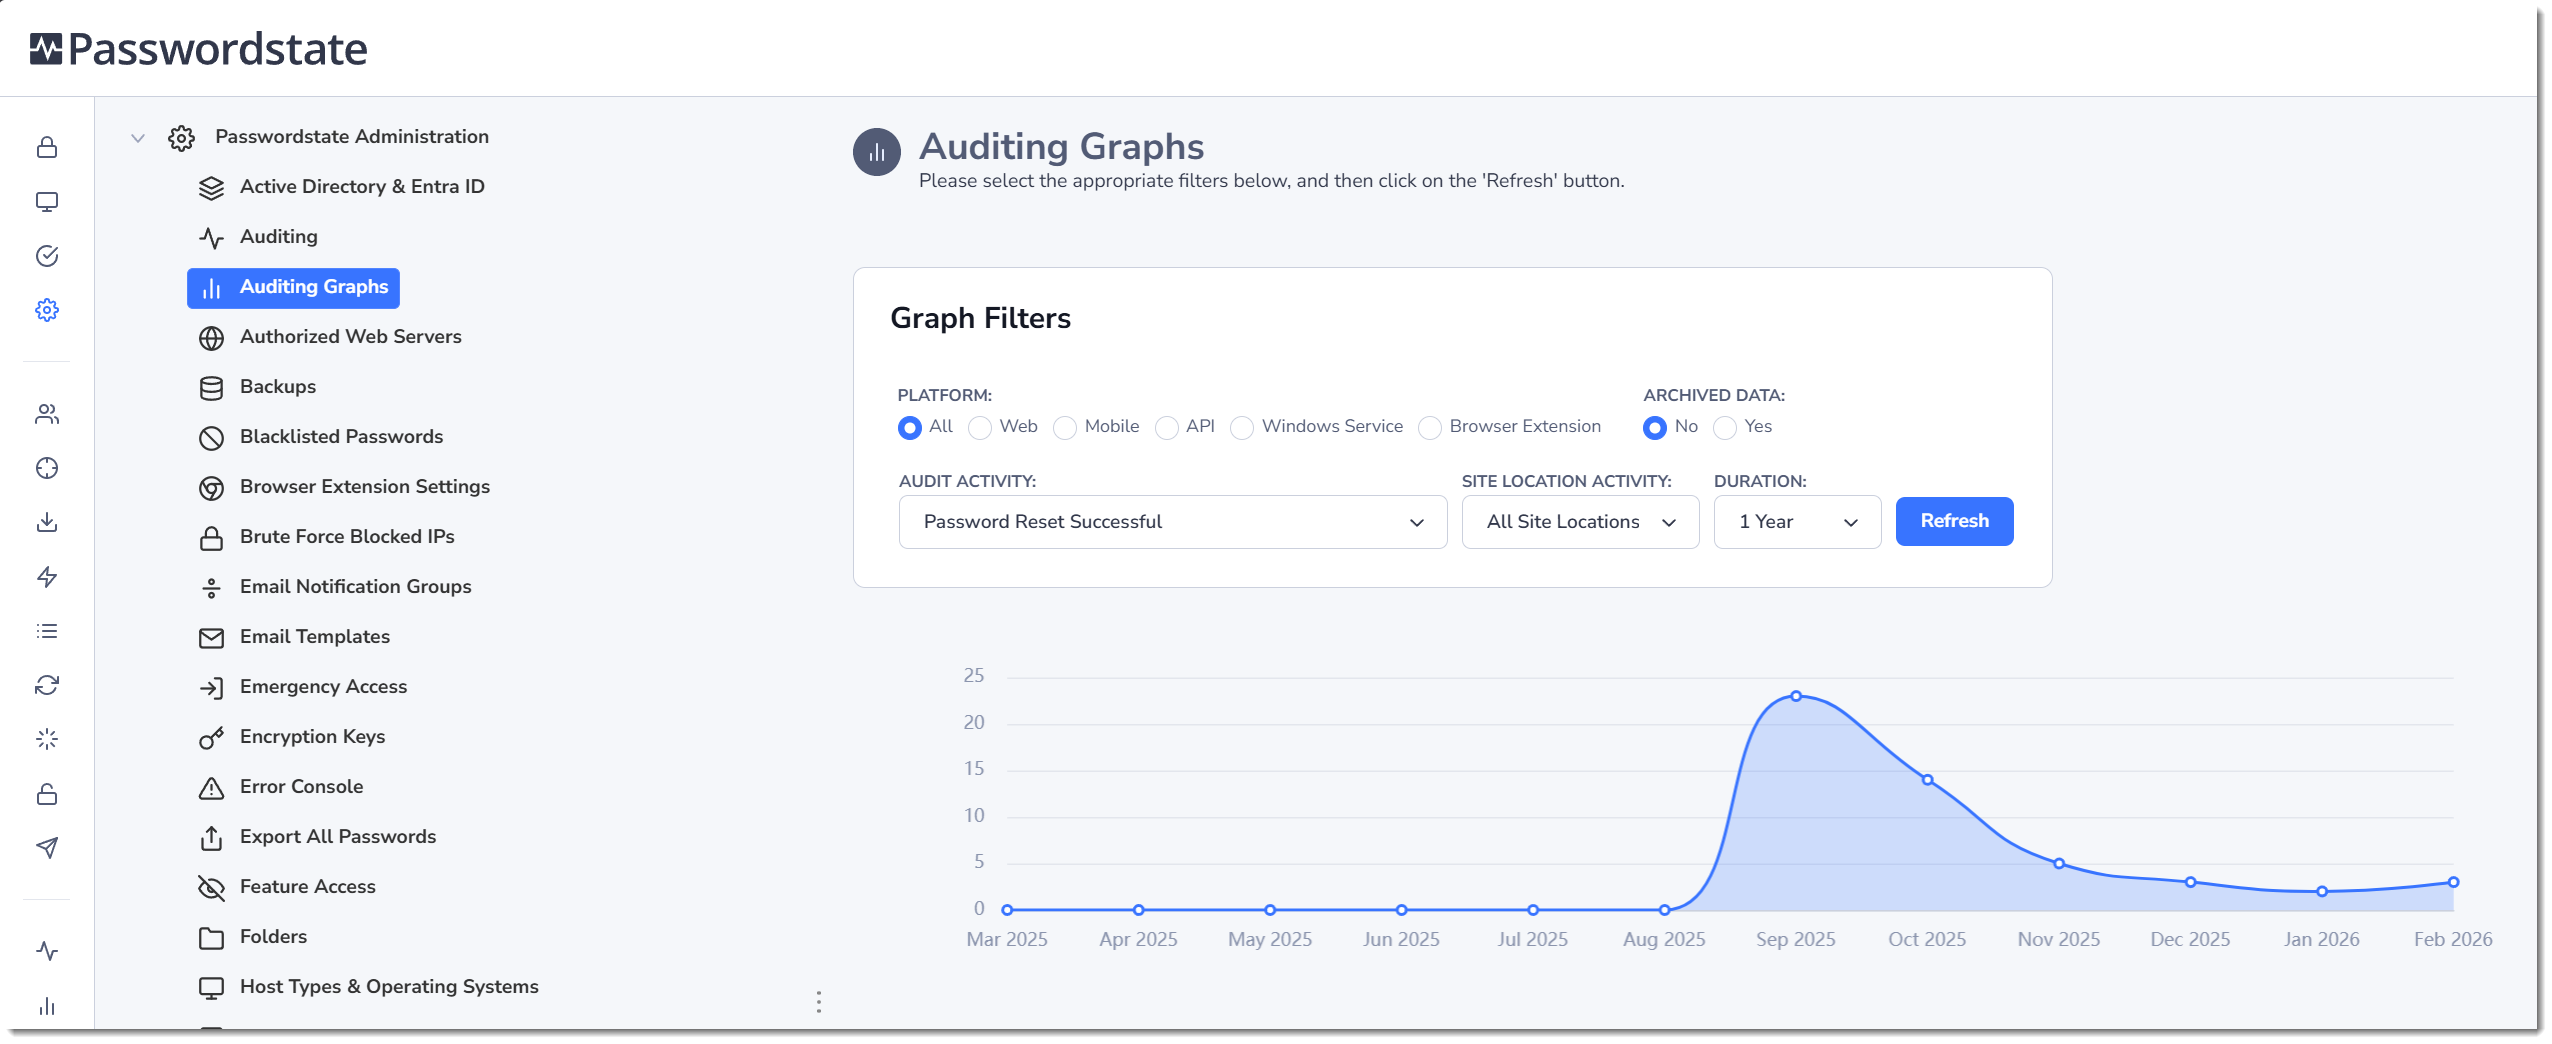
The Auditing Graphs screen is simply a graphical representation of the auditing data, with similar filtering options to the main Auditing page. Instead of filtering between dates, you just select a specified period i.e. 1 year, 2 years, etc.
Example screenshot below: